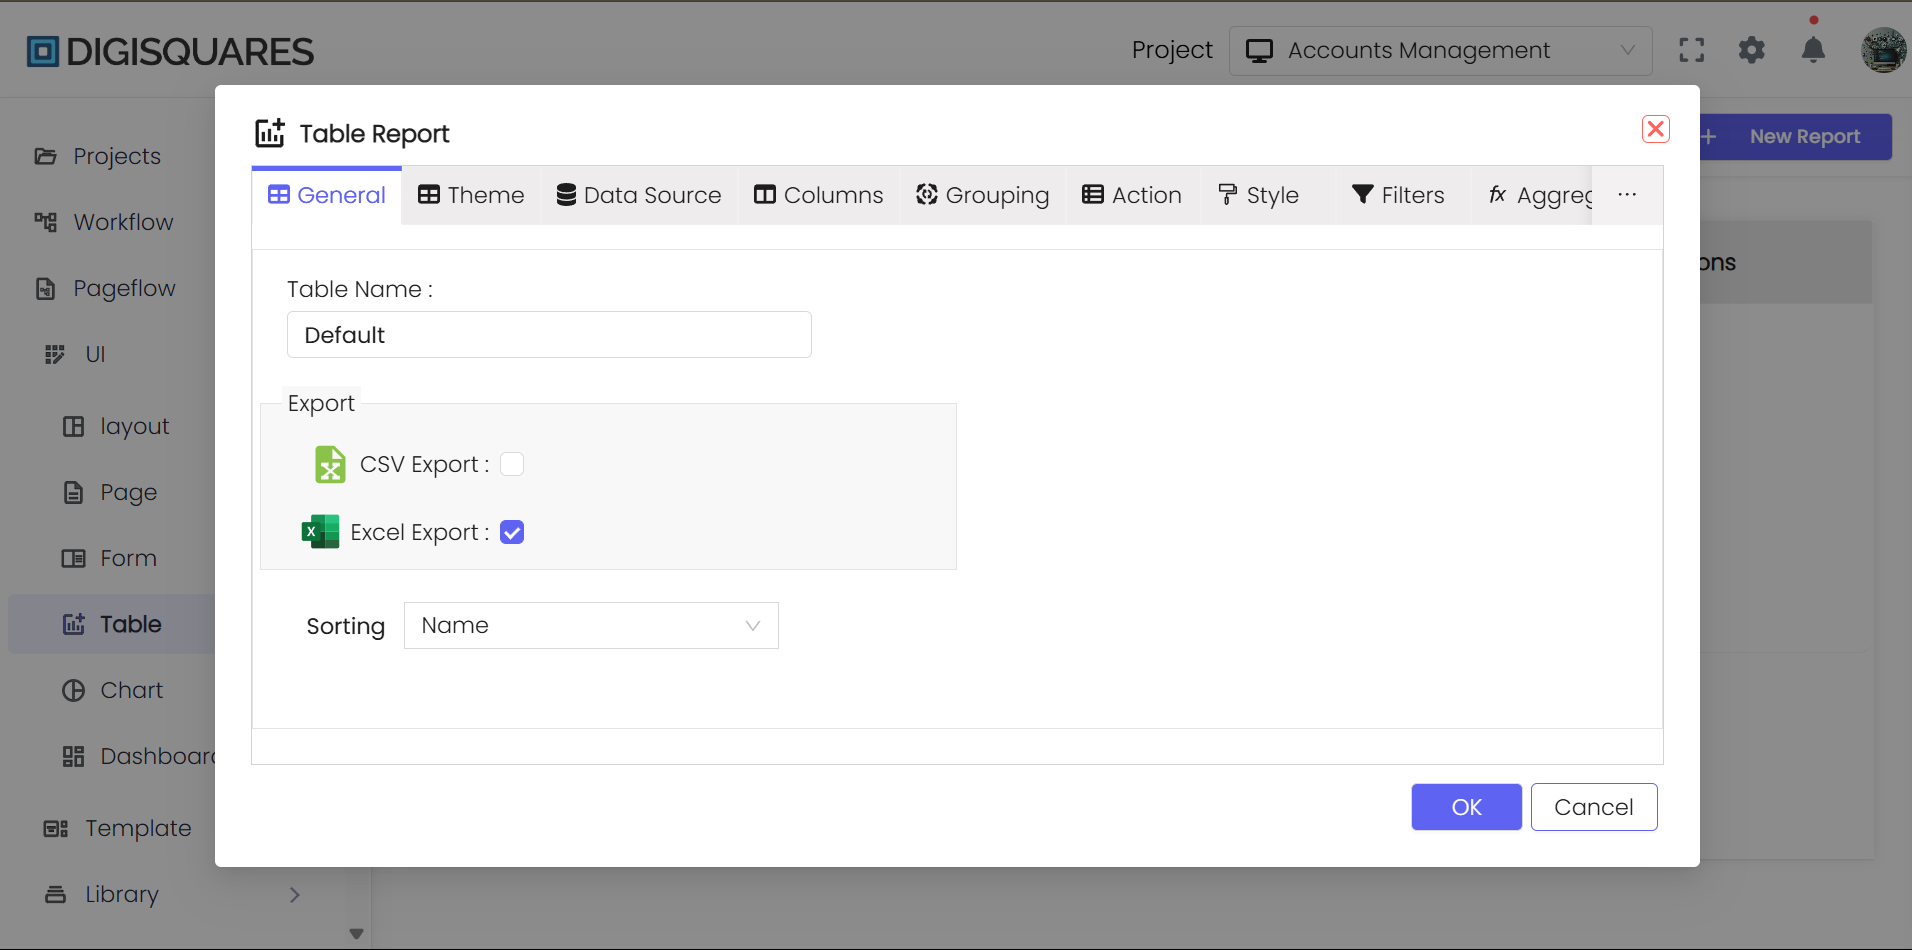
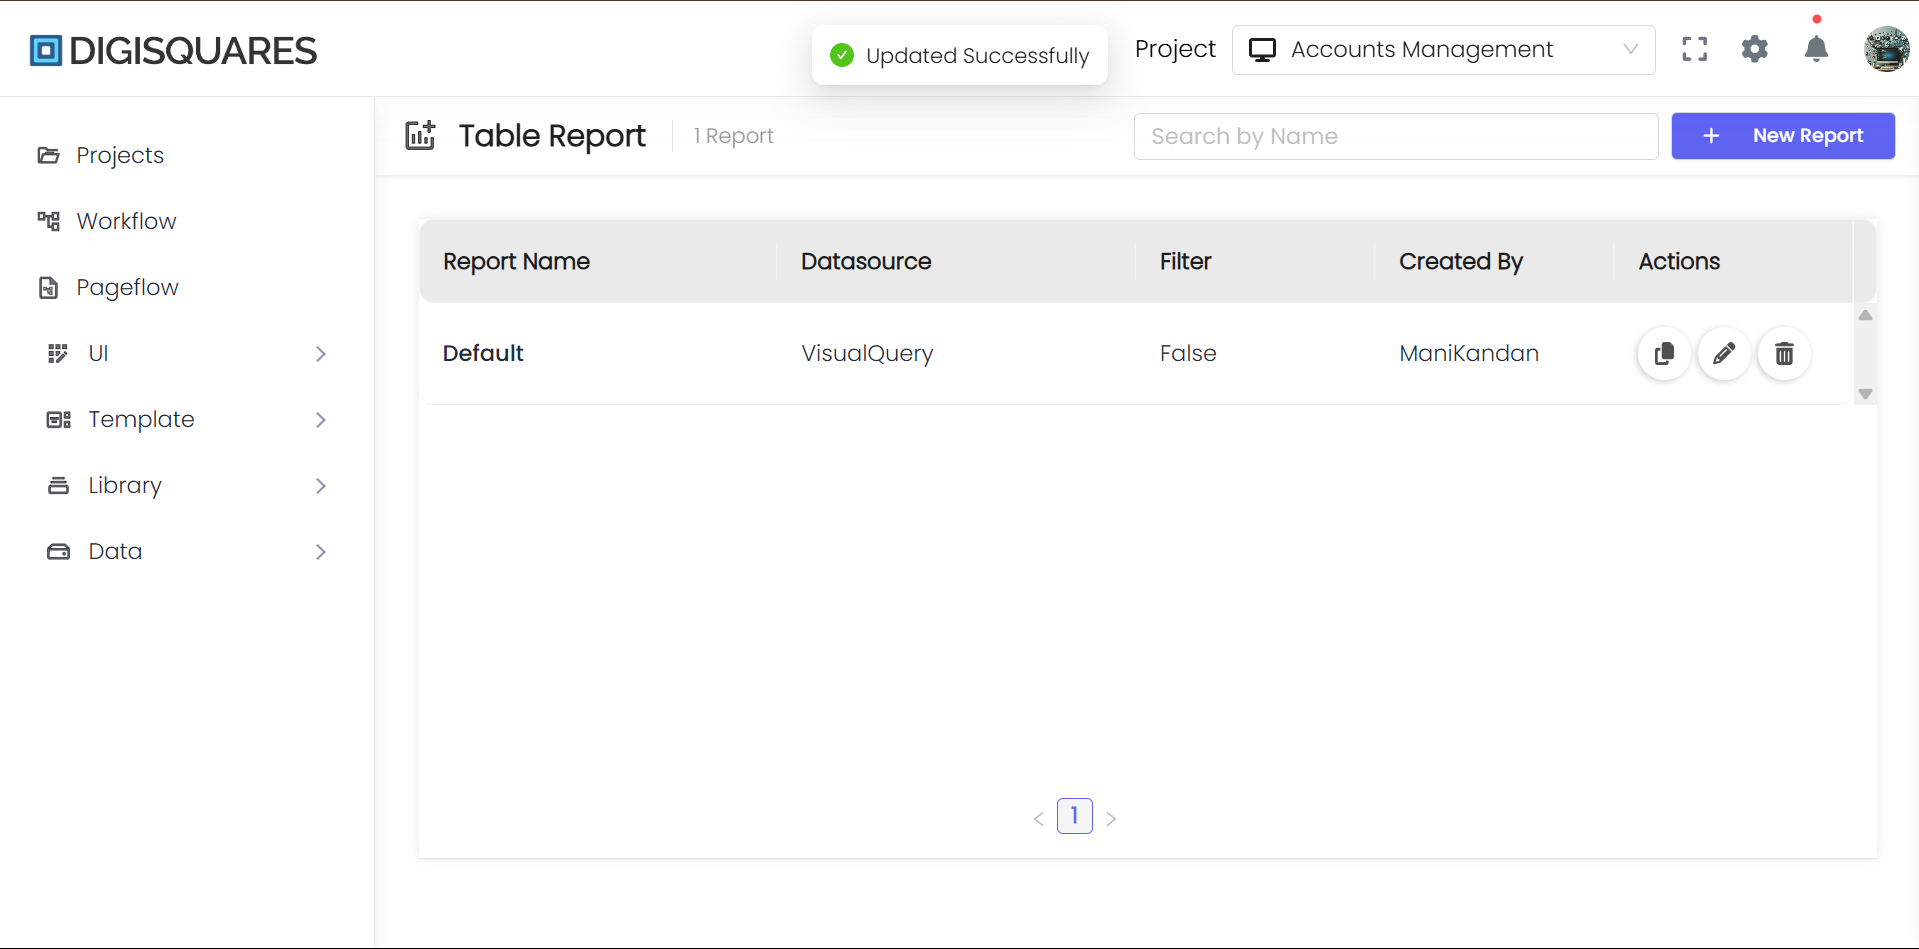
Report Creation
Introduction
Reports are documents or visual representations that present data in a structured and often formatted manner. They are typically generated from data stored in databases, spreadsheets, or other data sources, and are used for business intelligence, analytics, decision-making, and communication.

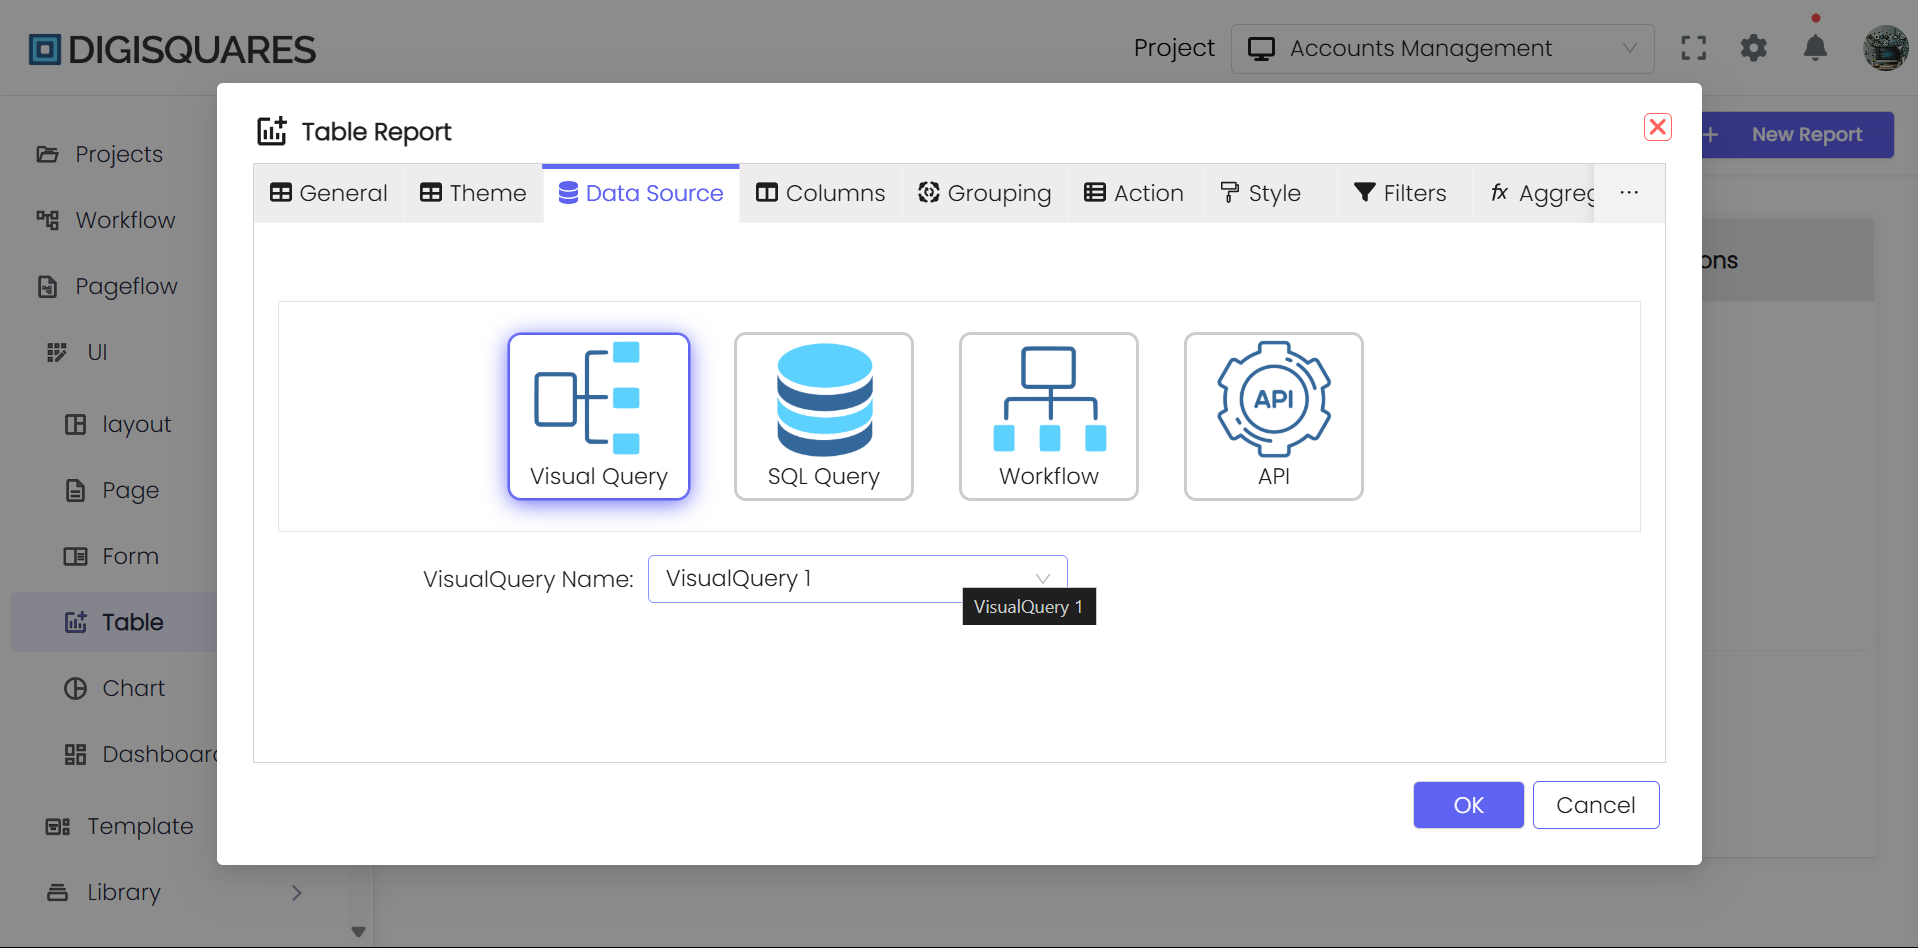
1. Data Source
The first step in creating a report is selecting the data source. You can choose from various data sources, including:
- Workflow
- Databases
- APIs
- Visual Query
- SQL Query
Steps to Follow:
- Access the report creation interface.
- Select the Data Source option.
- Choose the appropriate data source type (e.g., database, API endpoint).
- Configure the connection details (e.g., URL, credentials).
- Define the query or data retrieval mechanism.

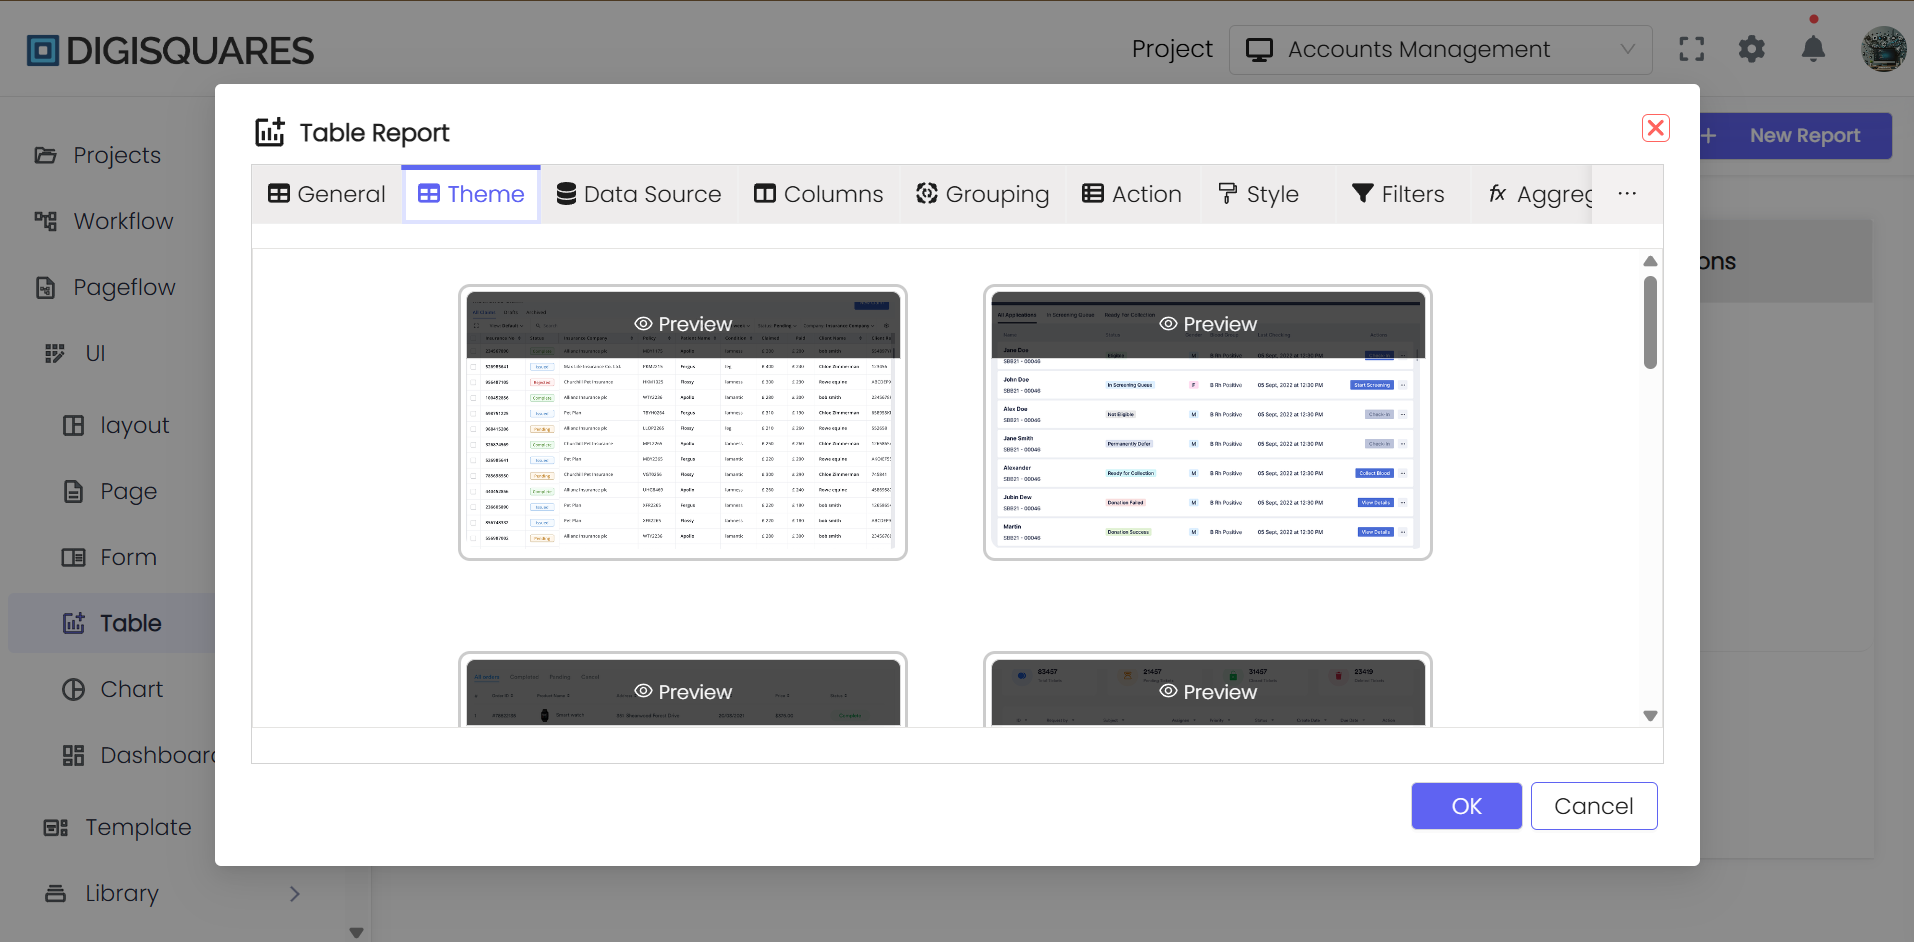
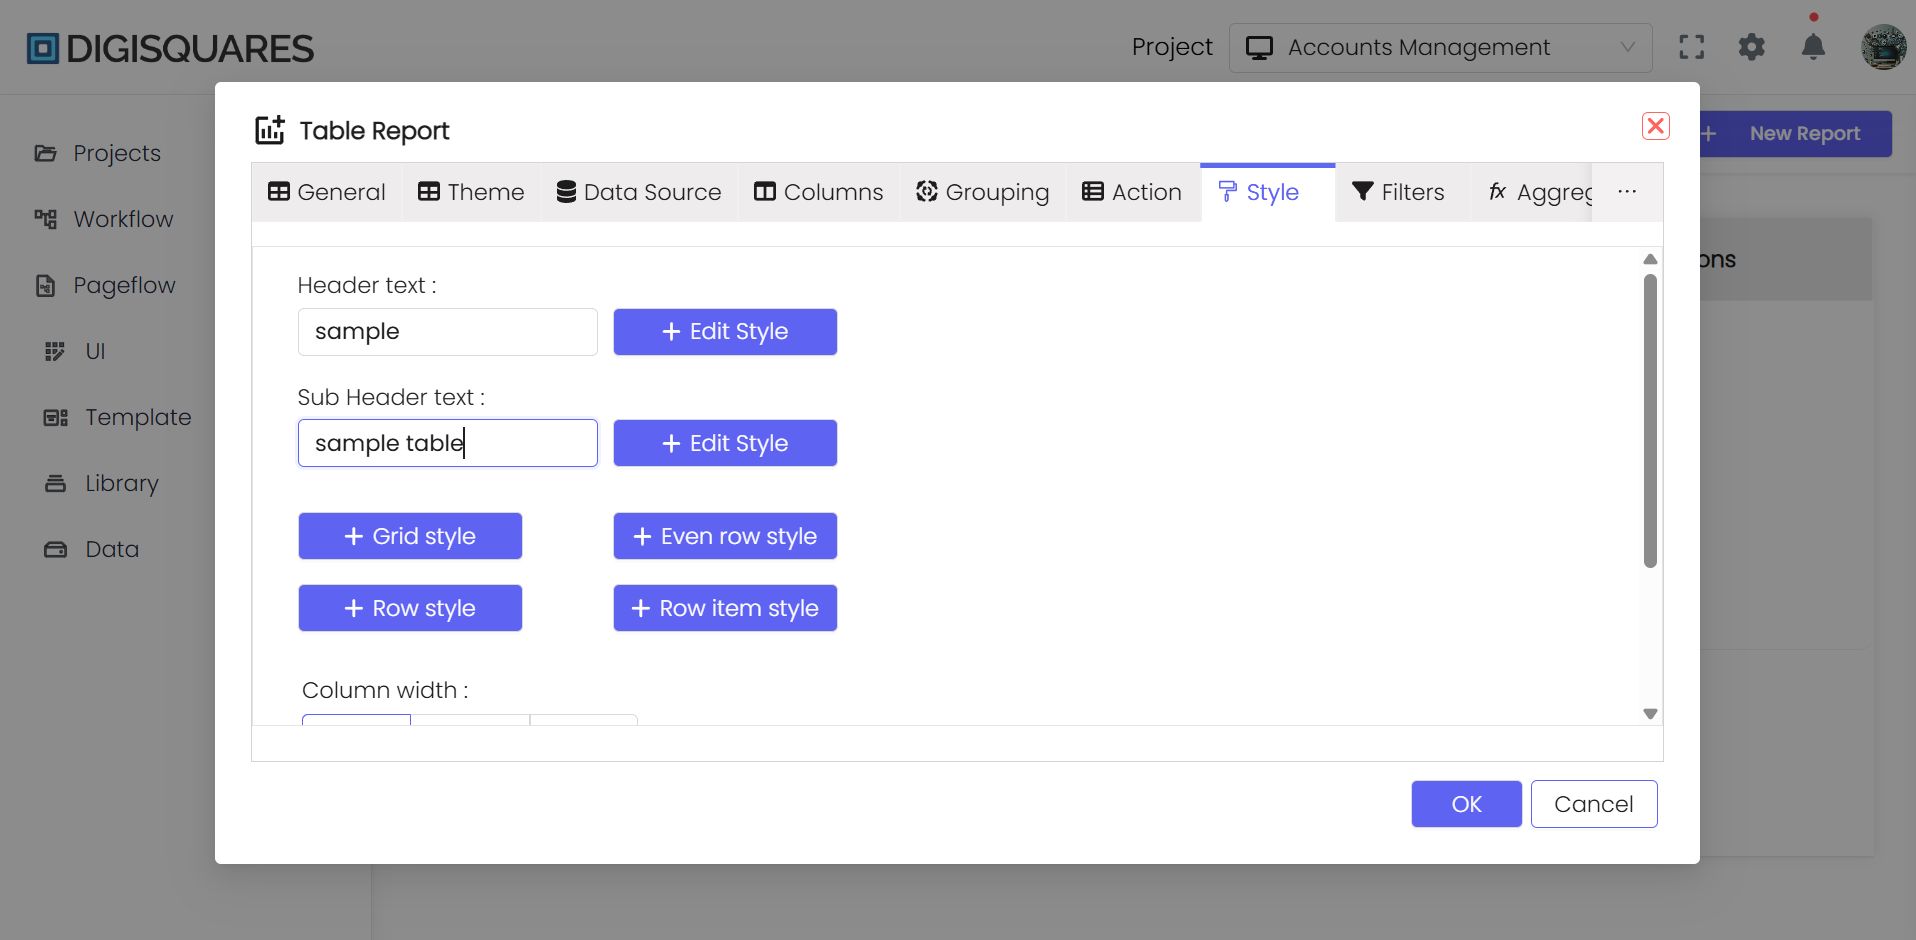
2. Grid Style
The grid style determines how data is presented in the report. You can customize various styles, such as header, subtext, grid rows, even rows, and row items to match your desired aesthetic.
Steps to Follow:
- Access the report design or formatting section.
- Modify the grid style settings.
- Customize header style, subtext style, grid style, and row style as needed.
- Preview the changes to ensure the grid style aligns with your design preferences.
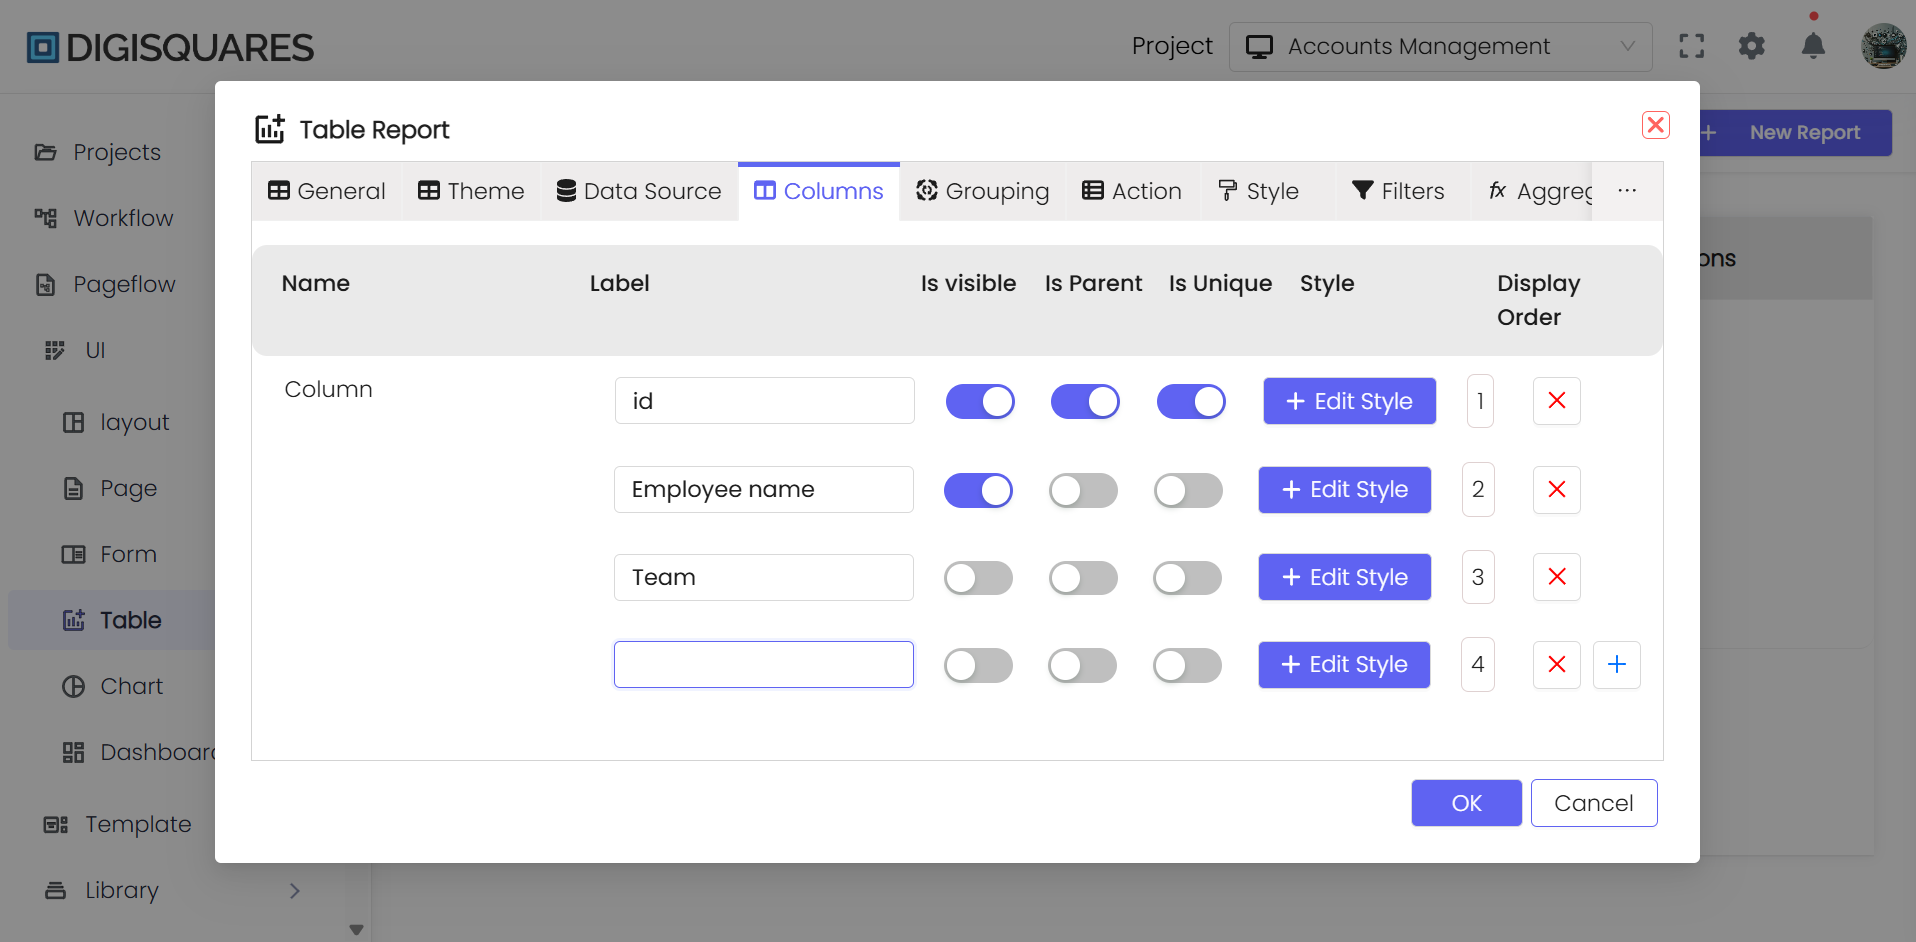
3. Column Configuration
Configuring columns involves specifying which data fields from the data source should be displayed in the report. You can define column headers and set their properties.
Steps to Follow:
- Access the report design or configuration section.
- Select the Column Configuration option.
- Add columns from the data source.
- Define column headers and properties (e.g., width, alignment).
- Rearrange columns as needed.
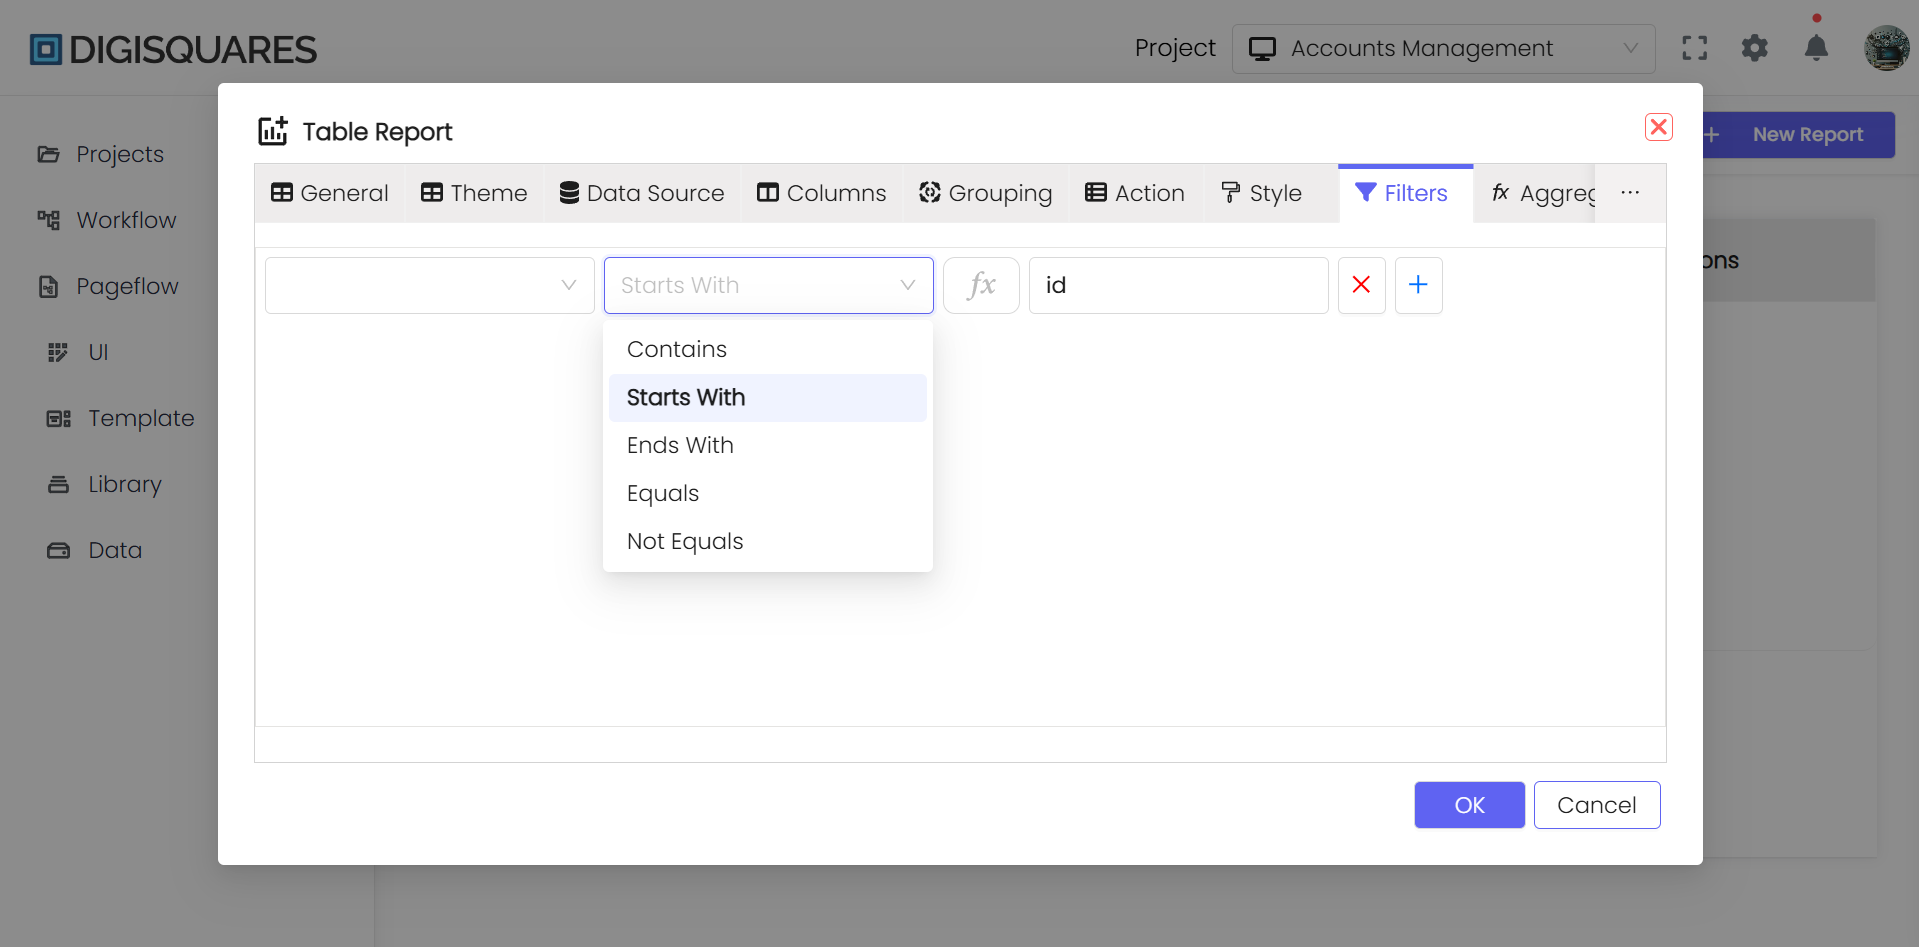
4. Filters
Filters allow users to narrow down the data displayed in the report by applying specific criteria. Users can interact with these filters to refine the report's content.
Steps to Follow:
- Access the filter configuration section.
- Add filter options based on relevant columns.
- Define filter types (e.g., text, numeric, date).
- Specify default filter values if applicable.
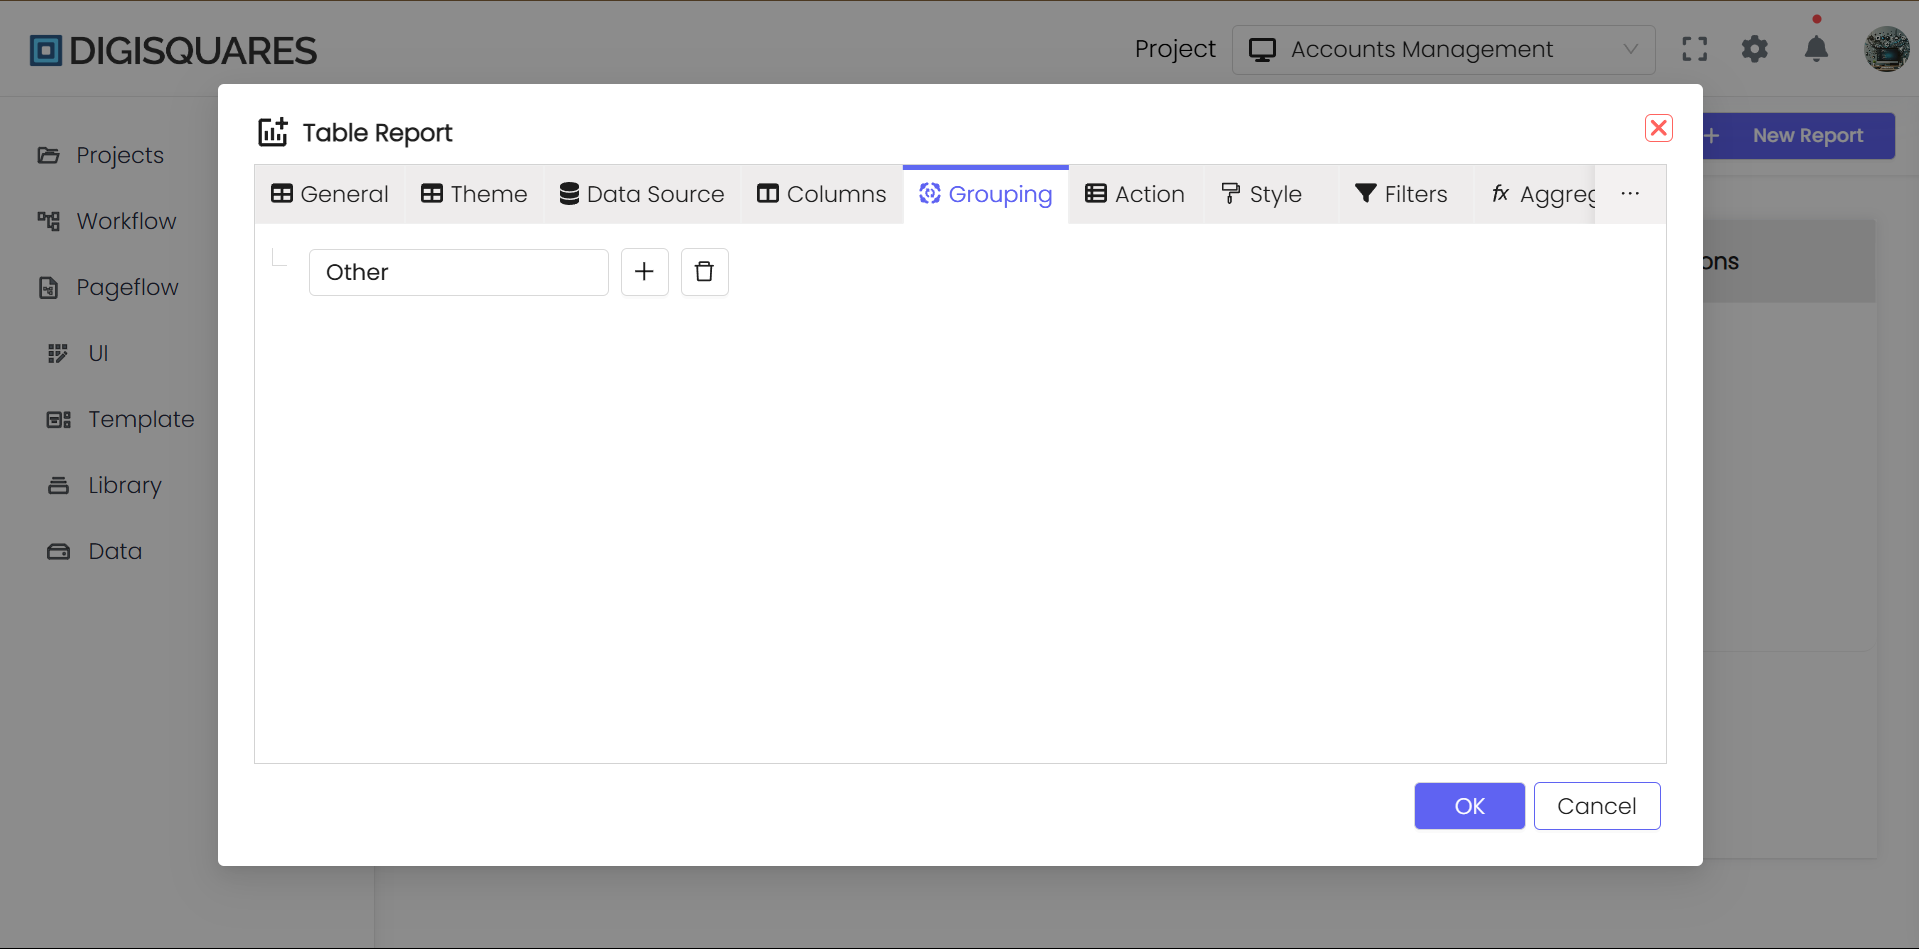
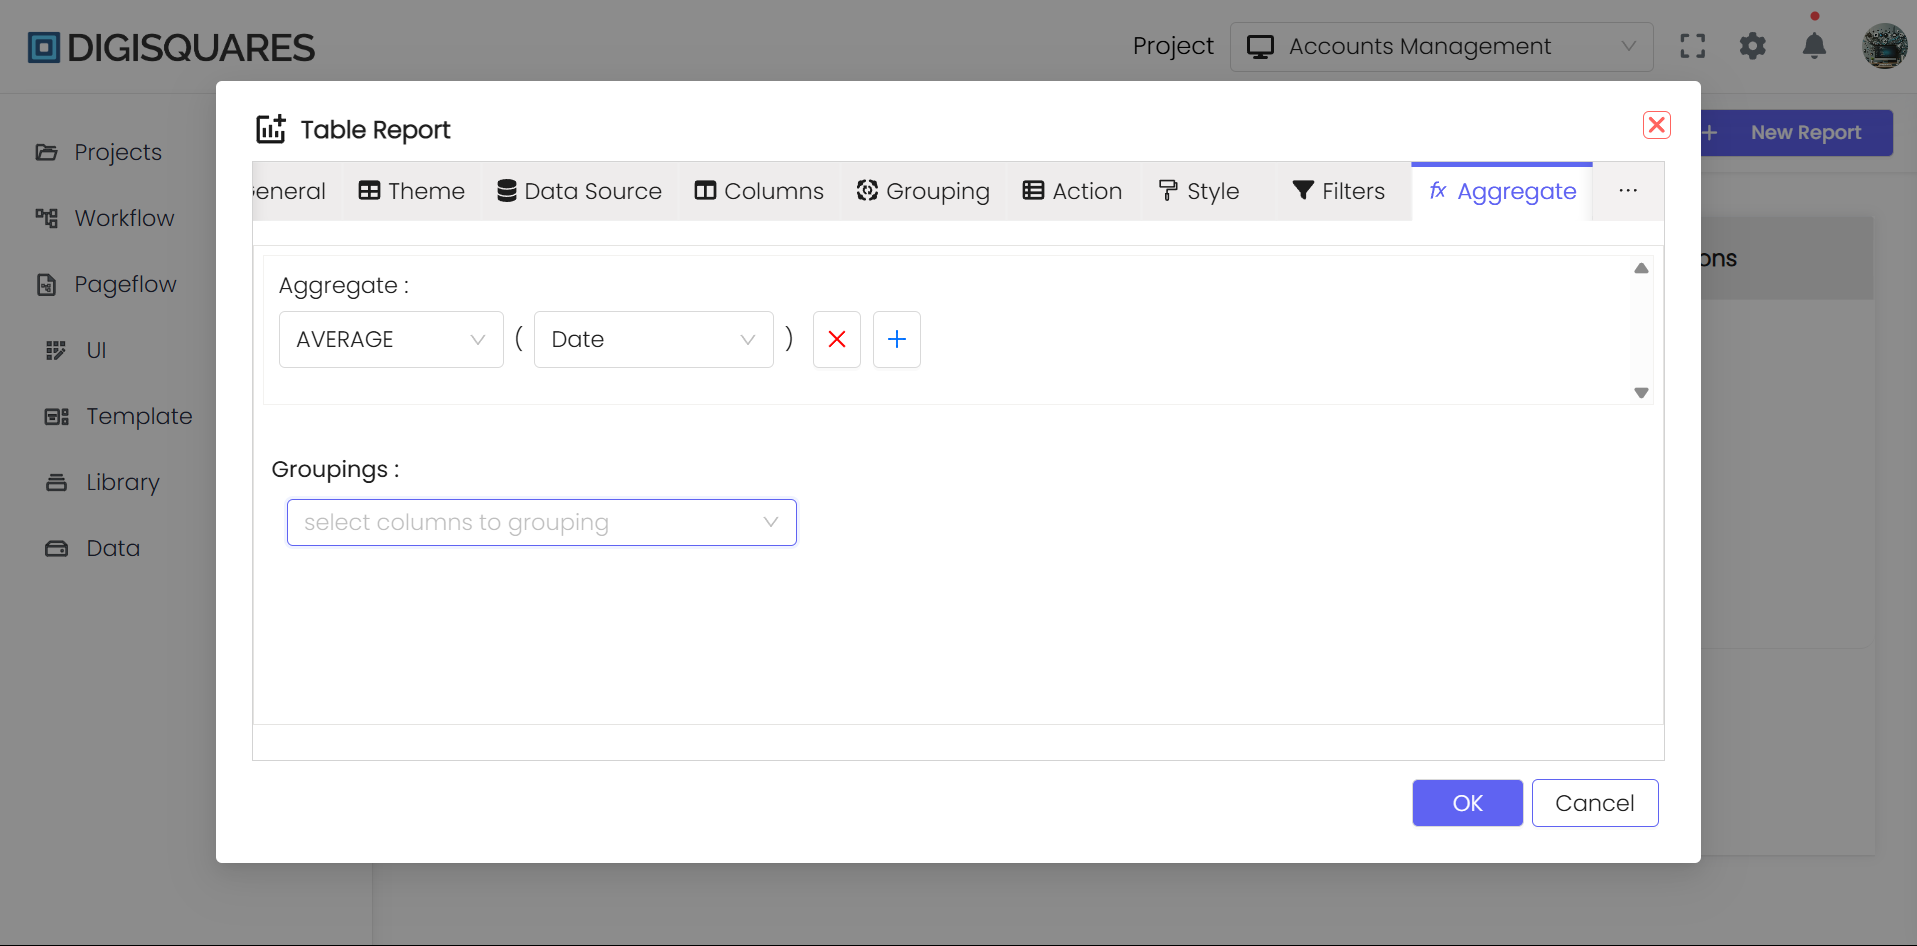
5. Aggregation
Aggregation enables you to summarize and analyze data in the report. You can apply functions like sum, average, and count to specific columns.
Steps to Follow:
- Access the aggregation settings.
- Choose the column(s) to aggregate.
- Select the aggregation function (e.g., sum, average, count).
- Define grouping and sorting if necessary.
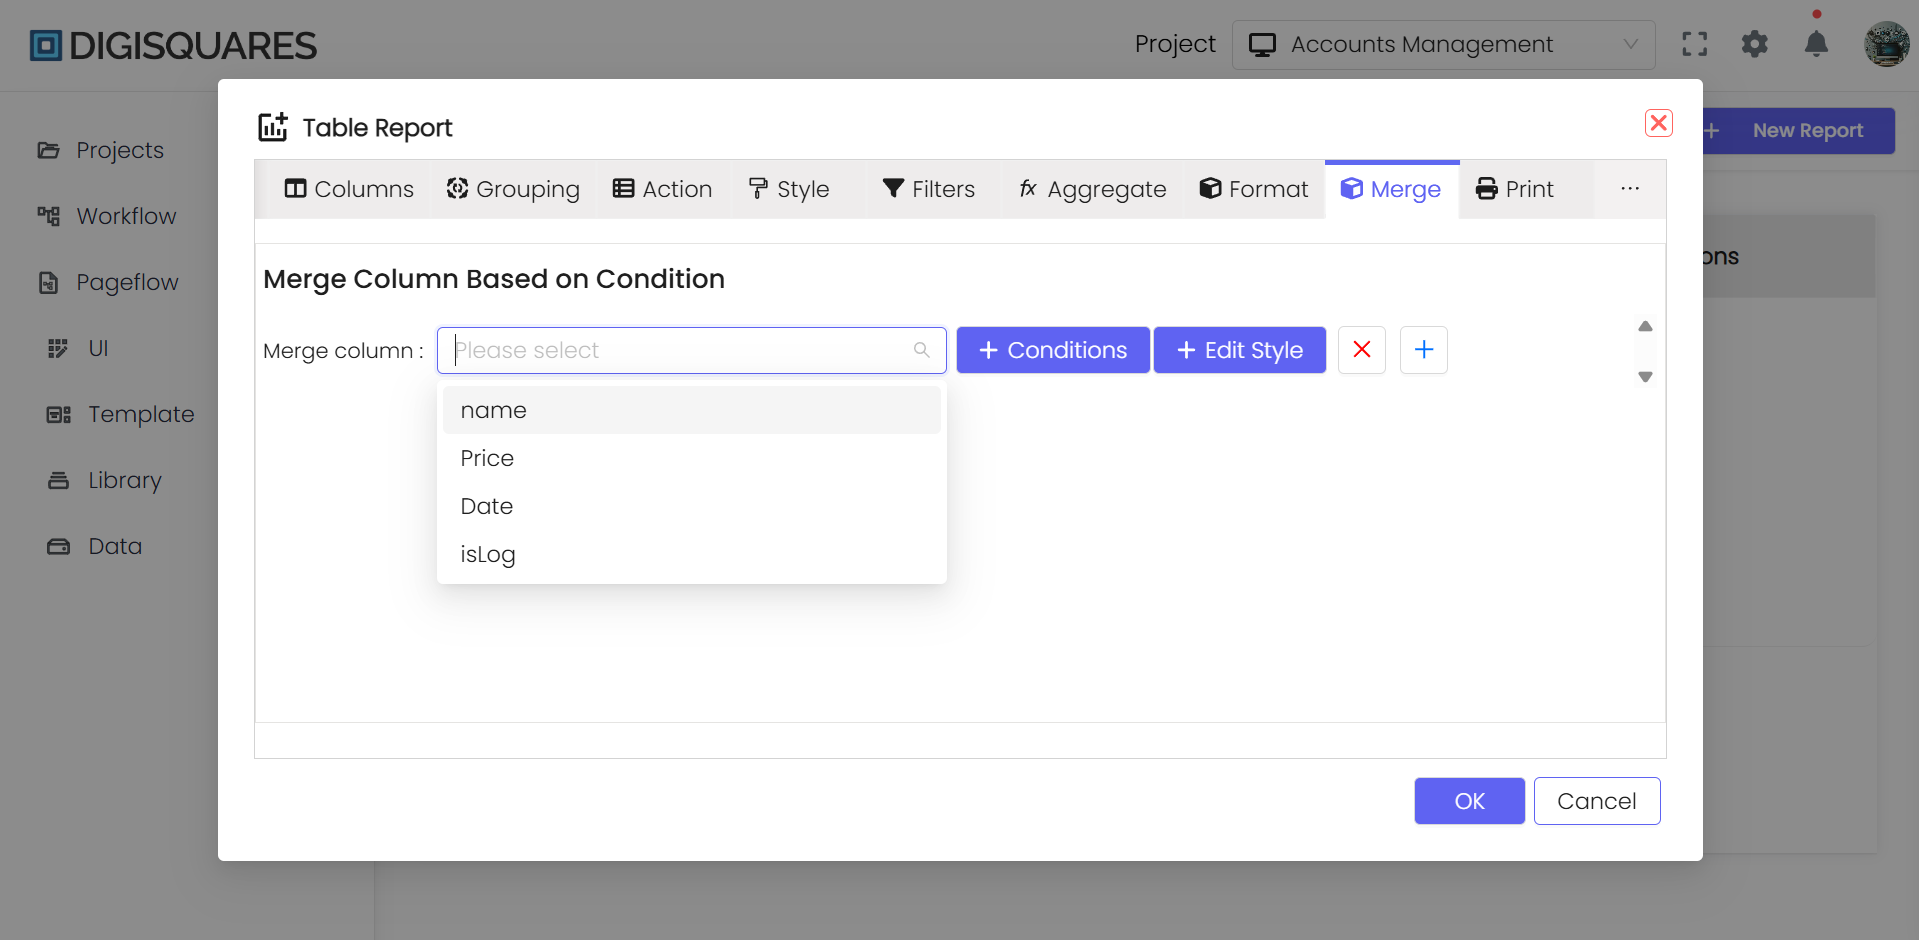
6. Merge Column
The Merge Column feature allows you to combine the content of multiple columns into a single column for a more concise presentation.
Steps to Follow:
- Access the Merge Column configuration.
- Choose the columns to merge.
- Define the separator or format for merged content.
- Specify the formatting rules (e.g., currency, date format).
- Add styles to the column.
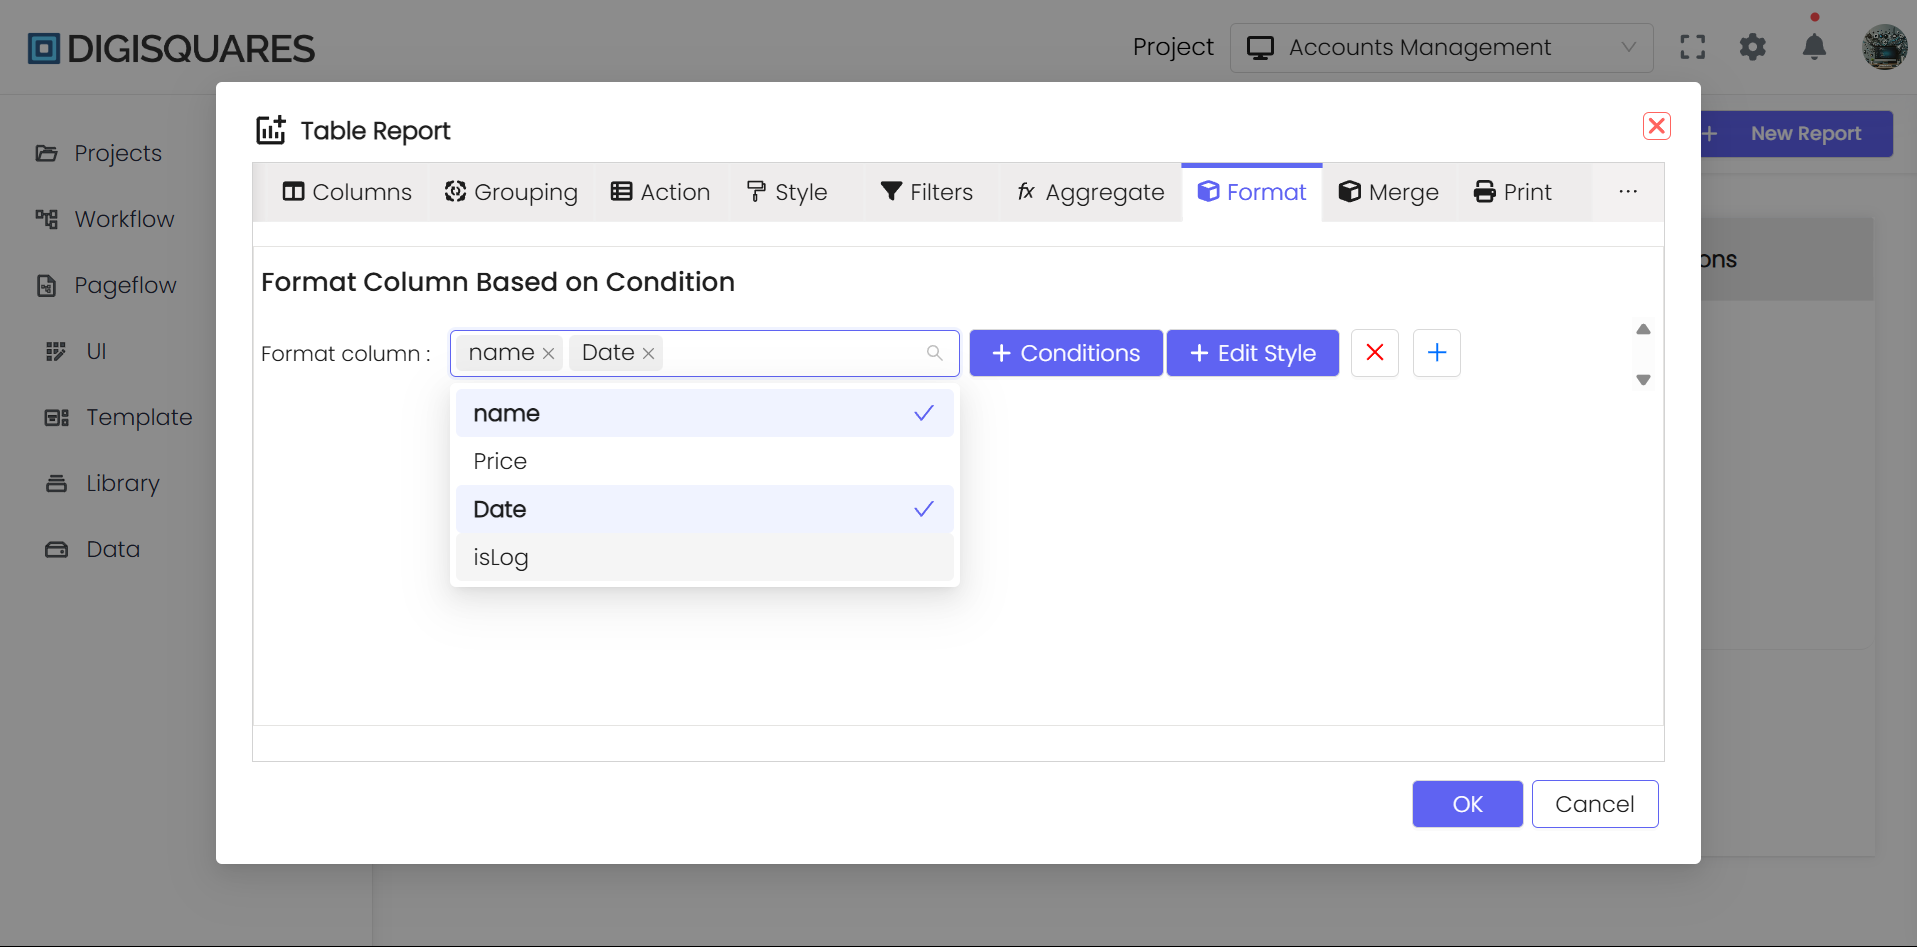
7. Format Columns
Formatting columns involves applying styles, such as number format, date format, or custom format, to improve the readability of data.
Steps to Follow:
- Access the column format options.
- Select the column(s) to format.
- Specify the formatting rules (e.g., currency, date format).
- Add styles to the column.
- Preview the formatted data to ensure it meets your requirements.
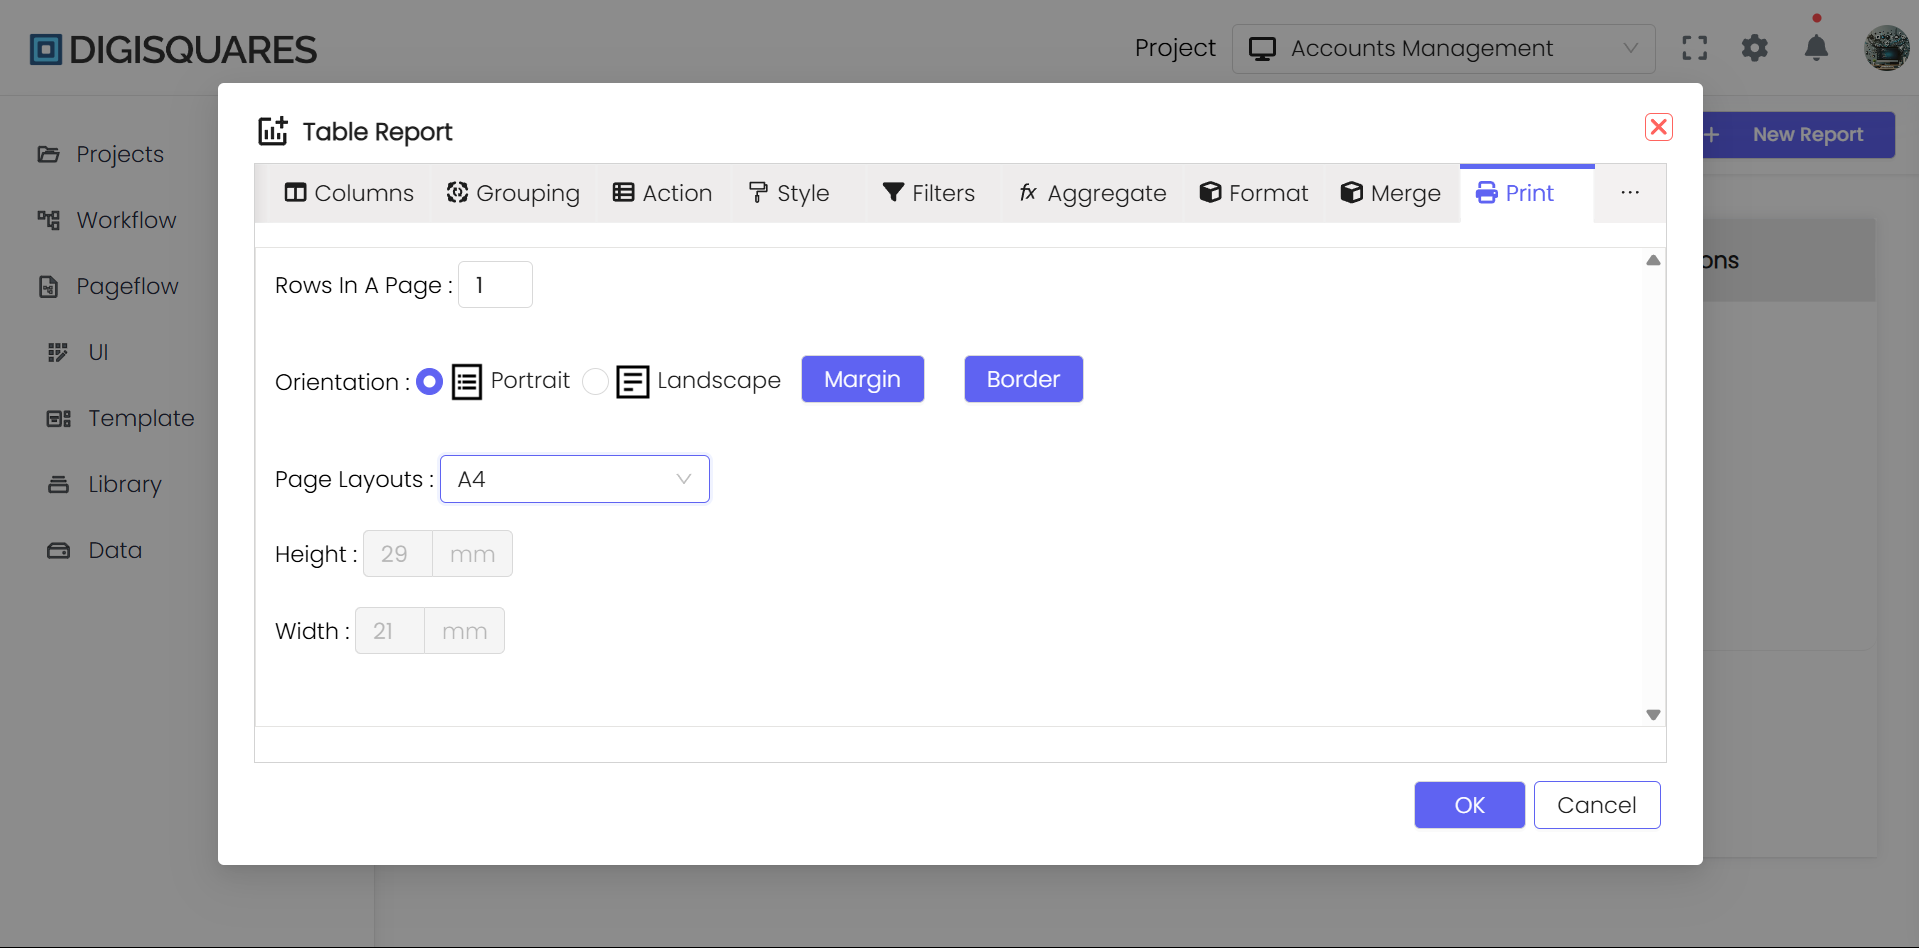
8. Print Reports
Once your report is configured and styled to your liking, you can provide options for users to print or export the report in various formats, such as PDF or Excel.
Steps to Follow:
- Access the report export/print settings.
- Define export options (e.g., PDF, Excel).
- Implement a Print or Export button within the report interface.
- Allow users to select their desired export format.


Summary
The Digisquares platforms provide powerful tools for UI report creation in web app development. Whether you need straightforward reports or highly customized analytics, the platform helps you design reports efficiently. For large or complex reports, ensure the platform’s capabilities meet your needs.